Howie Fenton
As the end of the year approaches and companies work on strategic planning for the coming year, it becomes helpful to think about the trends that will likely impact the industry of tomorrow. This article offers a top-level overview of three trends that we expect to impact the industry in the near future. These trends are expected to provide sales and profit growth opportunities for commercial and in-plant printers alike.
Critical Trends for 2016
#1: The Return of Traditional Products and Services
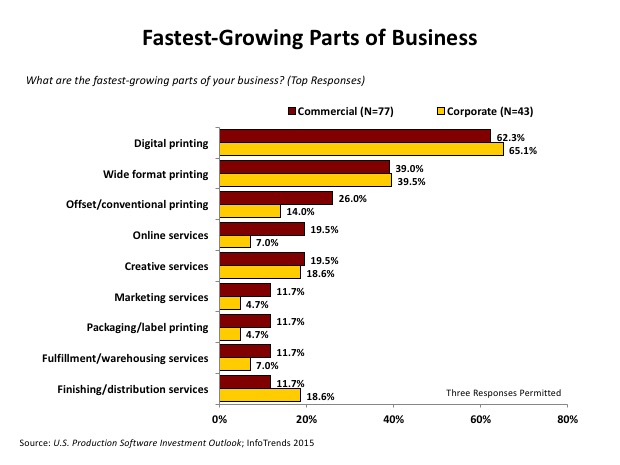
The first trend was discussed in an earlier article entitled A Renewed Focus on Core Print Services and a Slowing PSP-to-MSP Migration. Our industry is currently seeing a return to core competencies like digital printing, wide format printing, and offset/conventional printing. According to InfoTrends’ 2015 report entitled U.S. Production Software Investment Outlook, the fastest-growing services are not the ones that need to be built from scratch. Services that many companies have been offering for years (e.g., digital printing, wide format printing, offset printing, creative services) are currently seeing faster-than-average growth.

Figure 1: What are the fastest-growing parts of your business? (Top Responses)
#2: Leading PSPs and In-Plants Are Growing Due to Value-Added Services
Although an increase in the sale of traditional products and services is always welcome, it can be accompanied by an unwelcome side effect—difficulty maintaining profitability or margins. Pricing pressures remain a dominant force, which leads us to the second trend: A focus on creating, introducing, and fostering the sales of more value-added products and services.
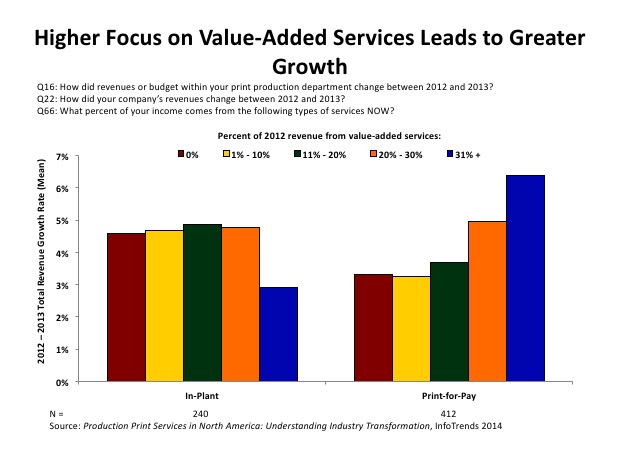
As might be expected, commercial (print-for-pay) printers that attribute a greater percentage of their revenue to non-print value-added services are expected to experience the highest growth. This same trend was less true for in-plant printers. This is because the value-added services that print-for-pays are performing may be assigned to other groups within an in-plant’s parent company or organization (e.g., marketing, IT) that the management within the parent company believes is better suited to handle them. This can become a problem for in-plants because they may be left printing commodity type products (e.g., stationery), which makes it harder to prove a strategic alignment with the parent company and makes them more susceptible to the threats of outsourcing. Although it can be challenging, in-plants are encouraged to fight for those value-added services (e.g., VDP, cross-media production) to help meet their financial objectives and better align with their parent organizations. Additionally, some in-plants are more focused on value-added services like mail facilities or data centers. Very often, the volume for these services is directly reflected on the volume of business the parent company/organization.

Figure 2: A Focus on Value-Added Services Generates Growth
#3: A Greater Focus on Utilization Rate
The third and final trend is not tied to a specific product or service; it is focused on measuring operations and benchmarking performance based on how companies utilize equipment (also known as utilization rate). We have focused on operational benchmarks like sales per employee and revenue as a percentage of sales for decades, but the businesses that are growing their sales or increasing their profitability today do not necessarily align with these traditional benchmarks.
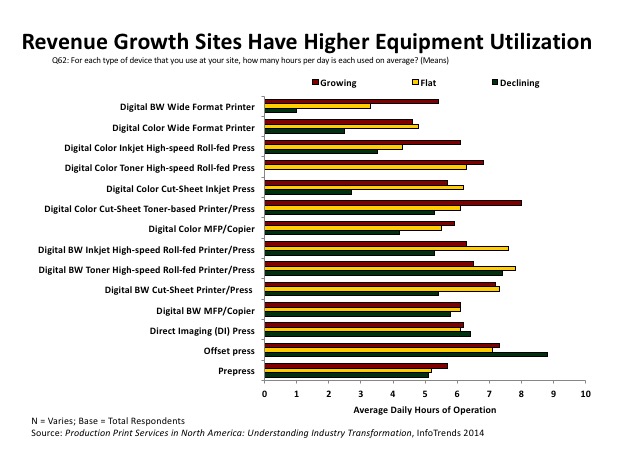
As is the case in other industries where equipment, staff skills, and procedures have changed, we may need to identify next- generation metrics that correlate more closely with the most successful companies. InfoTrends has been testing alternative measurements over the past few years, and leading companies typically had higher equipment utilization rates than those that were flat or declining.
The Figure below illustrates how the utilization of certain types of equipment correlates with growth. Sites that were experiencing a decline showed the greatest use of offset presses, but those that were growing had higher utilization rates of digital devices (e.g., cut-sheet and roll-fed equipment).

Figure 3: On average, how many hours per day is each type of device used? (Means)
The Bottom Line
Most of the companies that we speak with welcome and applauded the increasing sales of traditional products and services. In an industry that is battling to maintain value and relevancy, this is good news. Nevertheless, there are still pricing pressures that drive many of today’s purchasing decisions. This is generating growth in value-added services. Although these value-added services often differ by company, they typically include design, web-to-print services, variable data printing, wide format, fulfillment, mailing, and marketing/cross-media services.
While many companies measure performance, they can’t always use this metric to take action and improve their performance. While “production/hour” metrics (jobs entered/hour, preflights/ hour, pages/hour, inserts/hour, etc.) are still used, they often result in rework issues. While the “sales/employee” ratio is also popular, many leading companies actually look like laggards using this ratio. Utilization rates are now being tested as a new benchmark because they can help identify production bottlenecks and cross-training opportunities. Once bottlenecks are identified, cross-training programs can be developed so companies can shift staff from slower areas to busier areas. Increasing utilization reduces bottlenecks, increases productivity, lowers manufacturing costs, and results in more sales growth.